Key Performance Indicators Digital Marketing Guide
Why Digital Marketing KPIs Are Your Business Navigation System
Imagine trying to drive to a crucial meeting in a city you’ve never visited before. You have no map, no GPS, and the road signs are all blank. That's what running a digital marketing campaign feels like without the right KPIs. Key Performance Indicators (KPIs) are your strategic compass, guiding every decision from how you allocate your budget to when you need to change direction. They transform streams of confusing data into clear, actionable insights that truly move your business forward. Without them, you're just guessing. With them, you can navigate with precision and a clear path to growth.
Turning Numbers into a Narrative
The real magic of key performance indicators in digital marketing isn’t just in the numbers themselves; it’s in the story they tell. These metrics reveal the plot of your customer's journey, showing you where the story is compelling and where it falls flat. For instance, a high number of website visitors is a great start, but a low conversion rate tells you the story breaks down before the climax—people are showing up, but they aren't taking the action you want them to.
This storytelling approach is vital for keeping your team accountable and motivated. When your team understands the why behind the numbers, they become more invested in the outcome. A KPI stops being just a target to hit and becomes a reflection of their collective effort. It turns an abstract goal like "increase brand presence" into a concrete objective, such as "achieve a 20% increase in branded search queries quarter-over-quarter." This clarity gets everyone, from content creators to sales teams, aligned on what success looks like.
Aligning KPIs with Business Objectives
Ultimately, the most powerful KPIs are the ones directly tied to your core business goals. While vanity metrics like social media likes can feel good, they don’t pay the bills. The real value is in tracking indicators that have a tangible impact on your bottom line. Research backs this up. A recent UK study found that for 54% of businesses, increasing sales revenue was their most important KPI. The same report showed brand awareness and customer engagement were also top objectives for 42% of companies, respectively. This highlights a clear focus: businesses are prioritising metrics that directly fuel financial health and market position. You can explore more findings by reading the full 2025 State of Digital Marketing Report.
This alignment prevents what’s often called "measurement for measurement's sake." Every KPI you track should answer a critical business question:
- Objective: Increase market share.
- Relevant KPI: Customer Acquisition Cost (CAC) versus Customer Lifetime Value (LTV).
- Objective: Improve customer loyalty.
- Relevant KPI: Customer Churn Rate or Net Promoter Score (NPS).
- Objective: Boost online sales.
- Relevant KPI: E-commerce Conversion Rate or Average Order Value (AOV).
By connecting your measurement system directly to these high-level objectives, you create a powerful feedback loop. Your KPIs don't just report on what happened in the past; they become a dynamic tool that steers your strategy. This ensures every marketing pound is spent effectively, contributing to sustainable, long-term success. It's how smart marketers move beyond expensive guesswork and build campaigns that deliver predictable, profitable results.
The Four Essential KPI Categories That Actually Matter
For many marketers, data can feel like a tidal wave. With dozens of metrics for every campaign, it's easy to get lost tracking numbers that don't signal real success. The trick is to organise your focus. Instead of chasing every digit, smart marketers group their key performance indicators (KPIs) for digital marketing into four distinct categories. These align directly with the customer journey and your core business goals, preventing data overload and ensuring you measure what truly moves the needle.
This simple diagram shows the direct link between setting clear business goals, selecting measurable KPIs, and achieving improved performance.
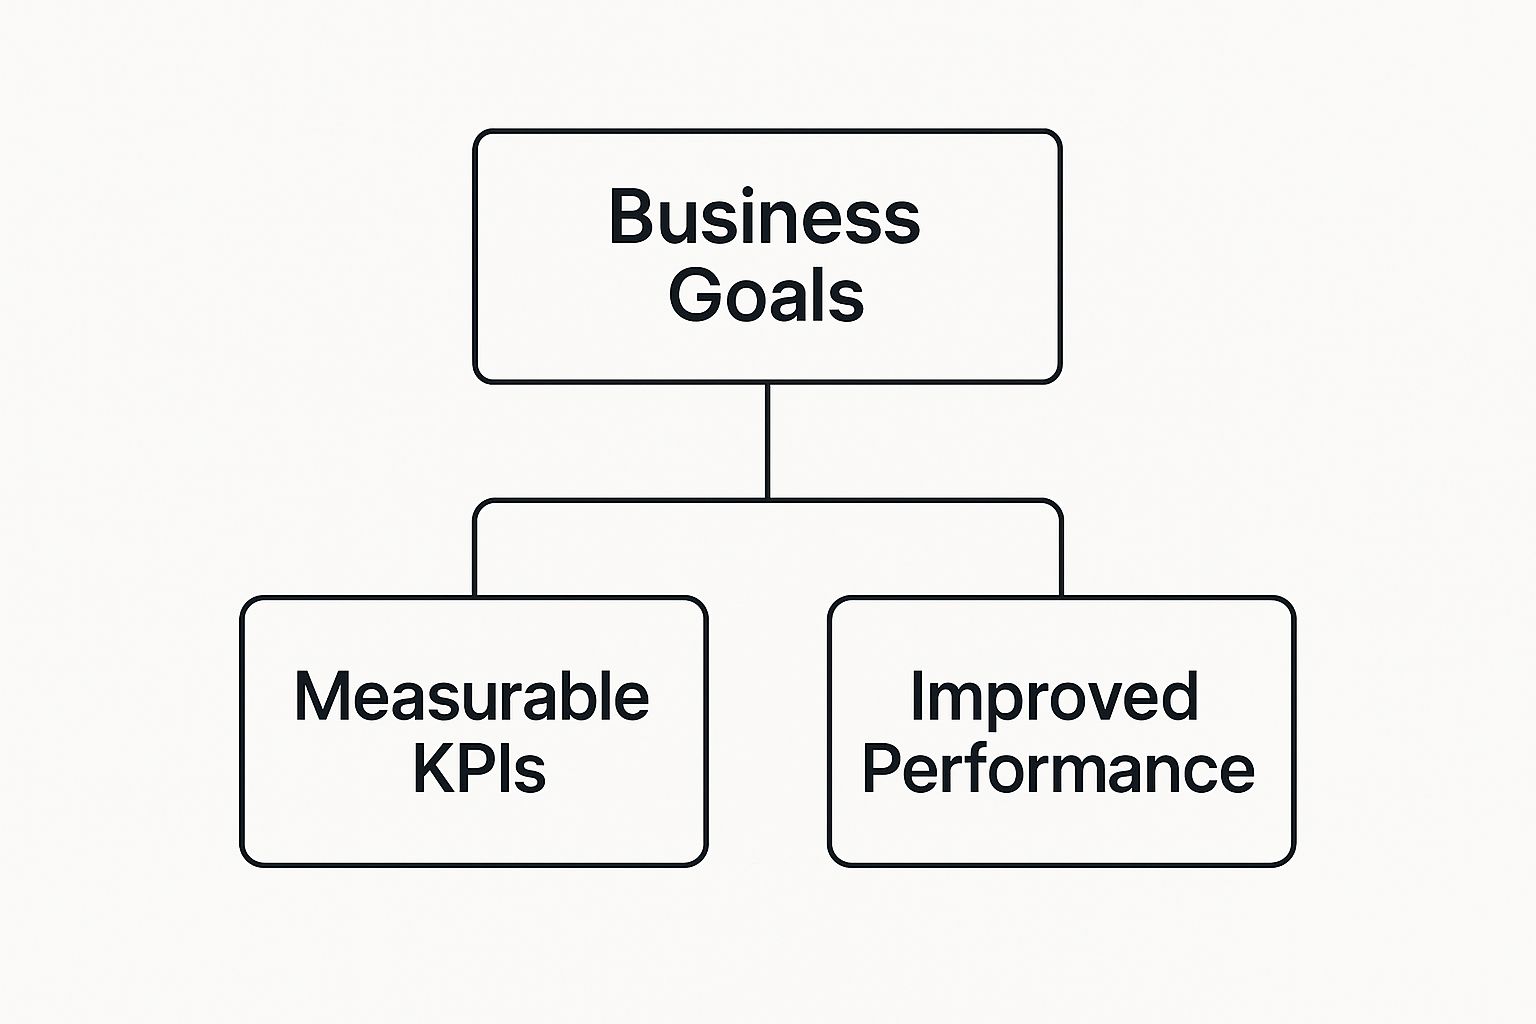
This visual highlights a core principle: your KPIs should be the bridge connecting your high-level strategy to your tangible results. Let’s break down these four crucial categories.
1. Awareness Builders: Capturing Initial Attention
Before you can make a sale, people need to know your brand exists. This is the top of the marketing funnel, where the primary goal is simply to be seen and remembered. Think of it as setting up your shop on the busiest high street in town. You aren't trying to sell to every single person who walks by; you're just making them aware that your shop is there.
KPIs in this category measure your brand's reach and visibility, telling you how many people are encountering your brand for the first time.
- Website Traffic: The total number of visitors coming to your site.
- Impressions: The number of times your content or advertisement is displayed on a screen.
- Social Media Reach: The number of unique users who have seen your posts.
These are often called leading indicators because they help predict future activity. A steady rise in awareness metrics suggests a healthier pipeline for the stages to come.
2. Engagement Drivers: Sparking Interest and Interaction
Once someone knows you exist, the next challenge is to pull them in. Engagement metrics tell you how well you’re capturing and holding your audience's attention. Are they just window-shopping, or have they stepped inside to browse? High engagement is a strong signal that your content is hitting the mark and building a real connection.
This category includes KPIs like:
- Average Session Duration: How long visitors typically stay on your website.
- Click-Through Rate (CTR): The percentage of people who see your link and actually click on it.
- Social Media Engagement: The total of all likes, comments, shares, and saves on your posts.
These indicators are vital for gauging your content's quality and your audience's interest. For example, a low CTR on an email campaign suggests the subject line or offer wasn't compelling, even if many people opened it. For those looking to dive deeper, you might be interested in our guide on proven growth marketing strategies that turn engagement into expansion.
3. Conversion Catalysts: Inspiring Action
This is the point where your marketing efforts translate into real business results. Conversion KPIs track the specific, valuable actions you want users to take. This is the moment of truth where a browser becomes a buyer, or a casual visitor becomes a qualified lead.
To help you organise these metrics, we've created a table that breaks down the four main KPI categories, their key metrics, and their impact on your business.
| KPI Category | Primary Metrics | Measurement Frequency | Business Impact |
|---|---|---|---|
| Awareness Builders | Website Traffic, Impressions, Social Media Reach | Weekly/Monthly | Measures brand visibility and top-of-funnel health. Indicates potential future audience size. |
| Engagement Drivers | Average Session Duration, CTR, Social Media Engagement | Weekly/Monthly | Shows content effectiveness and audience interest. Higher engagement often leads to better conversion. |
| Conversion Catalysts | Conversion Rate, Cost Per Acquisition (CPA), Lead-to-Customer Rate | Weekly/Monthly | Directly measures marketing ROI and sales effectiveness. Translates marketing effort into tangible results. |
| Revenue & Retention | Customer Lifetime Value (LTV), Customer Retention Rate, Churn Rate | Monthly/Quarterly | Assesses long-term business health and customer loyalty. High LTV is a sign of a sustainable model. |
This table provides a clear framework for seeing how different metrics contribute to the bigger picture, from initial awareness right through to long-term profitability.
Key conversion metrics include:
- Conversion Rate: The percentage of visitors who complete a desired goal, like making a purchase or filling out a form.
- Cost Per Acquisition (CPA): The average cost your business incurs to gain one new customer.
- Lead-to-Customer Rate: The percentage of leads that successfully convert into paying customers.
These are considered lagging indicators because they confirm the success of your earlier awareness and engagement efforts. A strong conversion rate is the ultimate proof that your entire marketing funnel is performing well.
4. Revenue and Retention: Nurturing Long-Term Value
Bringing a new customer on board is just the start of the journey. The most successful businesses are masters at turning one-time buyers into loyal, repeat customers. This final category of KPIs focuses on the long-term financial health and value of your customer base.
Essential KPIs for this stage are:
- Customer Lifetime Value (LTV): The total revenue a business can reasonably expect from a single customer throughout their relationship.
- Customer Retention Rate: The percentage of customers you successfully keep over a specific period.
- Churn Rate: The percentage of customers who stop doing business with you, also known as attrition.
Tracking these metrics helps you understand the sustainability of your business. A high LTV combined with a high retention rate demonstrates that you're not just acquiring customers, but building valuable, lasting relationships that fuel growth.
Channel-Specific Metrics That Drive Real Results
Once you've defined your main KPI categories, the real work begins. The true art of measurement lies in understanding that each marketing channel speaks its own performance language. The metrics that spell success for an SEO campaign are worlds apart from those that matter for a social media push. Applying a one-size-fits-all approach is like judging a fish on its tree-climbing skills—it’s not just unfair, it's useless for gauging actual performance.
Think of it like this: your overall business goal is the destination, but each marketing channel is a different vehicle. You wouldn't measure a race car's fuel efficiency the same way you'd track a cargo ship's tonnage. Likewise, the key performance indicators for your digital marketing must be tailored to the unique strengths and aims of each platform. This focused approach is what separates basic reporting from strategic, results-driven analysis, allowing you to see exactly what’s working, where, and why.
Organic Search (SEO) KPIs
With Search Engine Optimisation (SEO), the goal is to boost your visibility in search results and attract relevant, high-quality visitors. This isn’t just about getting any traffic; it's about getting the right traffic.
- Keyword Rankings: Tracking your position for target keywords shows if your optimisation efforts are paying off. Moving from page two to the top three for a crucial term is a significant win.
- Organic Traffic: This measures visitors who find your site through non-paid search results. A steady rise points to growing authority and relevance in your niche.
- Click-Through Rate (CTR): This is the percentage of people who see your site in search results and actually click on it. A high CTR suggests your page titles and meta descriptions are hitting the mark. If you're struggling to bring visitors in, you might want to look at our guide on how to drive more traffic to your website.
Social Media KPIs
Social media thrives on building a community and sparking conversations. While follower count is easy to see, the truly valuable indicators measure how your audience interacts with your content.
- Engagement Rate: This is the total number of interactions (likes, comments, shares) on a post, divided by your followers or reach. It’s a direct measure of how well your content connects with your audience.
- Reach vs. Impressions: Reach is the number of unique people who see your content, while impressions are the total number of times it was displayed. Tracking both helps you understand its true viral potential.
- Share of Voice (SoV): This metric stacks your brand’s mentions against your competitors', giving you a clear picture of your presence in the market.
Content and Video Marketing KPIs
Content marketing, especially video, has become a powerhouse for engagement and conversions. The main focus here is on how deeply the audience connects with what you've created. Recent data reveals that for 60% of video marketers, engagement rate is the number one KPI, followed by conversion rate at 56% and click-through rate at 52%. These numbers show a clear industry shift towards tracking how video directly influences viewer behaviour and business goals. You can discover more about the impact of video marketing trends in the latest industry reports. This makes metrics like average view duration and audience retention essential for understanding what truly holds a viewer's interest.
Mastering PPC And Paid Advertising Performance Indicators
While organic marketing channels steadily build momentum, paid advertising delivers something else entirely: immediate and precise feedback. Picture your paid campaigns as a high-performance vehicle in your marketing garage. They can get you to your destination incredibly fast, but only if you are watching the right gauges on the dashboard. Mastering the key performance indicators for your digital marketing here means looking beyond surface-level numbers to understand what truly drives profit versus what just burns through your budget.
Beyond Clicks: Metrics That Signal Profitability
It's easy to get fixated on metrics like Click-Through Rate (CTR). While a high CTR shows your ad creative is compelling, it doesn’t guarantee success. The real story of a paid campaign’s health is told through indicators that connect clicks to costs and, ultimately, to revenue. These are the metrics that separate winning campaigns from expensive experiments.
Key performance indicators to focus on include:
- Cost Per Click (CPC): This is the direct cost for each click your ad receives. Monitoring CPC is fundamental for budget management, making sure you are not overpaying for traffic.
- Cost Per Acquisition (CPA): This is the total cost to acquire one new customer through your campaign. It’s a vital metric that moves beyond traffic to measure how efficiently your ad spend is creating actual business.
- Return On Ad Spend (ROAS): This is the ultimate measure of profitability. For every pound you spend on advertising, how much revenue do you get back? A ROAS of 4:1 means you're earning £4 for every £1 spent.
Focusing on CPA and ROAS ensures your campaigns aren't just generating activity, but are actively contributing to your bottom line. They are the true north for any paid advertising strategy.
The Deeper Dials: Quality Score and Conversion Rate
Two of the most powerful—yet often misunderstood—indicators in paid advertising are Quality Score and Conversion Rate. Quality Score is a rating (typically out of 10) that platforms like Google Ads give your ads, keywords, and landing pages. Think of it as your ad's reputation. A higher score means the platform sees your ad as highly relevant and useful, rewarding you with lower costs and better ad placements. A low score is a red flag that your message is misaligned with your audience’s intent.
Conversion Rate is the percentage of users who click your ad and then complete a desired action, such as making a purchase or filling out a form. A campaign might have a fantastic CTR and a low CPC, but if the conversion rate is poor, you're essentially paying to lead people to a dead end. Optimising your landing page experience is just as important as crafting the perfect ad. These two key performance indicators for digital marketing work together; a high Quality Score often leads to more relevant traffic, which in turn has a better chance of converting.
Pay-per-click remains a cornerstone for many businesses. In fact, research shows 67% of UK B2B marketers see PPC as crucial for lead generation, and 64% name it their most effective paid media strategy. With companies allocating an average of 12% of their total marketing budgets to these campaigns, mastering these performance indicators is not just an advantage—it's essential for financial success. You can discover more insights about PPC effectiveness in recent industry reports. This data confirms that a deep understanding of PPC metrics is vital for turning ad spend into sustainable growth.
Building Your KPI Tracking Infrastructure That Scales
Choosing the right digital marketing KPIs is a great start, but those metrics are just numbers on a page without a solid system to track them. It’s like having a world-class training plan for an athlete but forgetting the stopwatch, heart rate monitor, or weighing scales. You've set the goals, but you have no reliable way to measure your progress.
A scalable tracking infrastructure is what brings your KPI strategy to life, turning it from a theoretical document into a practical, day-to-day decision-making tool. This system needs to be able to grow alongside your business, delivering accurate and timely data that takes the guesswork out of your marketing efforts.
Selecting Your Core Tracking Platforms
Your tracking system is built on a foundation of a few key tools. Each platform gives you a different window into your performance, and when used together, they create a complete picture. The objective is to move from looking at isolated data points to understanding the entire customer journey.
- Google Analytics 4 (GA4): This is the essential centrepiece for almost any tracking setup. Google Analytics 4 is your main source for understanding website traffic, how users behave on your site, and what actions they take. Its event-based model is perfect for tracking the specific interactions that are most important to your business goals.
- Native Social Media Insights: Platforms like Meta Business Suite and LinkedIn Analytics offer detailed data on your audience's engagement, the reach of your posts, and your follower demographics. These are crucial for measuring how your social content is performing directly on each platform.
- Advanced Attribution Software: For businesses running multiple campaigns across different channels, attribution tools are indispensable. They help you see which touchpoints contributed to a final conversion, moving beyond a simple "last-click" view to show how all your marketing efforts work together.
The Power of Automation and Data Visualisation
Manually pulling reports from various platforms every week is inefficient and prone to human error. Forward-thinking marketing teams create automated reporting systems that save hours of work while improving data accuracy.
The right tools can automatically gather data into a single, unified dashboard. This gives everyone a real-time view of performance without any manual effort. One study found that over a third of marketers (34.2%) say their company rarely or never measures marketing ROI, often because gathering the data is too complex. Automation is the direct solution to this problem.
Once you have the data, the next step is making it easy to understand. This is where data visualisation shines. A clear chart or graph can explain complex trends much better than a spreadsheet filled with numbers. Visuals make your digital marketing KPIs accessible to everyone, from the marketing team to senior leadership, helping to build a data-aware culture. As your business grows, this clarity is essential for turning insights into meaningful actions and driving your overall digital marketing transformation.
To help you choose the right tools for your needs, we've compared some of the most popular options available for tracking, analysing, and visualising your data.
KPI Tracking Tools Comparison
| Tool Name | Key Features | Best For | Pricing Range | Integration Level |
|---|---|---|---|---|
| Google Analytics 4 | Event-based tracking, audience segmentation, cross-device measurement, predictive metrics. | Businesses of all sizes needing foundational website and app analytics. | Free tier available; custom pricing for enterprise (Analytics 360). | High (Integrates with Google Ads, Search Console, BigQuery, etc.). |
| Semrush | SEO, PPC, content marketing, and competitive research tools. Rank tracking and backlink analysis. | SEO professionals and marketing teams focused on search visibility and competitor analysis. | £107 – £410 per month. | Medium (Connects with Google Analytics, social media platforms, and various reporting tools). |
| HubSpot Marketing Hub | All-in-one CRM, email marketing, social media management, and analytics dashboard. | Businesses seeking a unified platform to manage marketing, sales, and customer service. | Free tools available; paid plans from £15 – £3,000+ per month. | Very High (Native integrations with hundreds of apps, plus custom API access). |
| Tableau | Advanced data visualisation, interactive dashboards, and business intelligence. | Data analysts and large organisations needing to visualise complex data from multiple sources. | £66+ per user/month (Creator). | Very High (Connects to hundreds of data sources, including databases, spreadsheets, and cloud apps). |
Choosing the right combination of these tools depends on your specific goals, budget, and the complexity of your marketing campaigns. Starting with a strong foundation like Google Analytics and then adding specialised tools as you grow is often the most effective approach.
Transforming KPI Data Into Campaign Optimisation Gold
Raw data from your digital marketing KPIs is like unrefined gold ore—it has immense value, but not in its current state. The real magic happens when you process this data, turning it into insights that guide your strategic actions. This is where you move from just reporting on what happened to actively shaping what happens next.
Think of it as a feedback loop: your performance indicators show you the results, you analyse the story behind the numbers, and then you make changes to improve the next outcome. This continuous cycle of analysis and optimisation is how top marketing teams build a lasting competitive edge.
From Analysis to Action: A Practical Approach
The first step is to spot trends and unusual patterns in your data. A sudden drop in organic traffic isn't just a number; it’s a signal to investigate. Did a core keyword ranking fall? Was there a recent Google algorithm update? Likewise, a spike in your email campaign’s click-through rate is an opportunity. Which subject line or call-to-action drove that success, and how can you replicate it?
This analytical process leads naturally to hypothesis-driven A/B testing. For example:
- Hypothesis: Changing the call-to-action button colour on our main landing page from blue to orange will increase the conversion rate because it stands out more.
- KPI to Track: Conversion Rate.
- Action: Run a split test showing 50% of visitors the original page and 50% the new version.
- Analysis: After a statistically meaningful period, compare the conversion rates to see if the hypothesis was correct.
This methodical approach removes guesswork, making sure your optimisation efforts are based on evidence, not just a gut feeling. It allows you to make small, steady improvements that add up to significant growth over time.
Using Data to Predict and Prevent
Advanced analysis of your key performance indicators for digital marketing allows you to move beyond simply reacting to problems and into proactive strategy. By tracking performance over time, you can spot early warning signs before small issues become costly headaches.
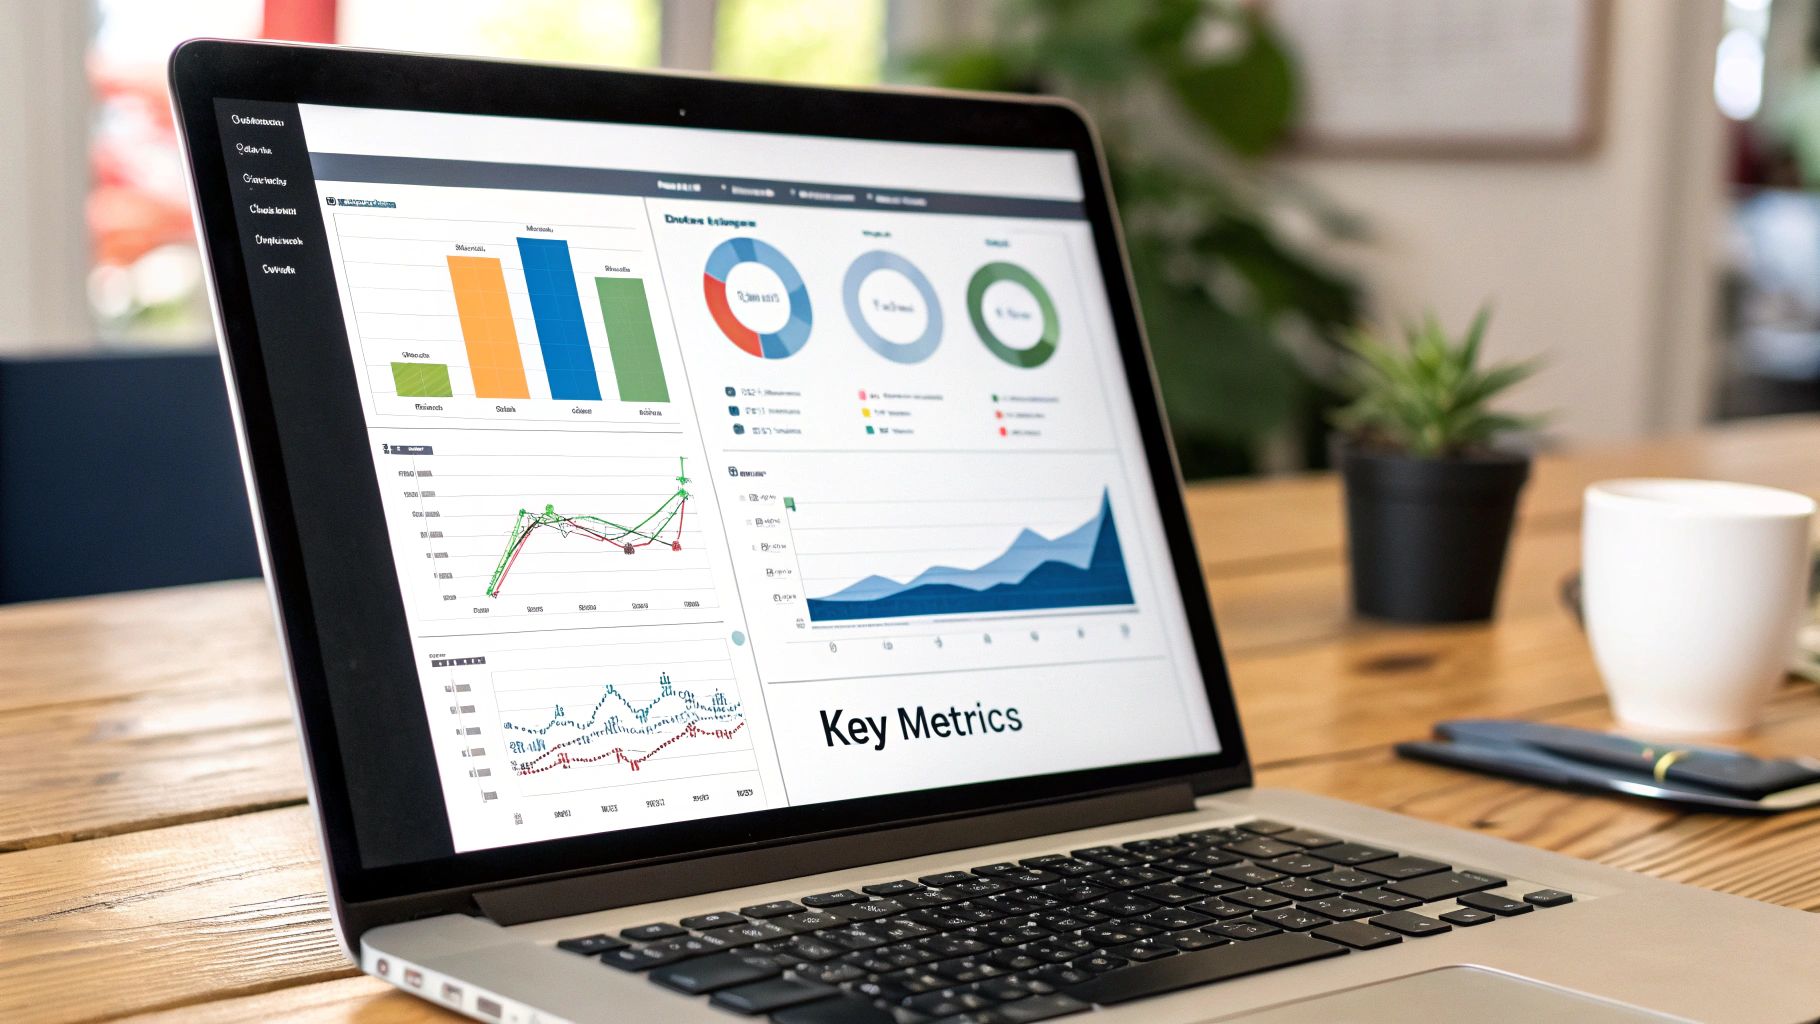
Dashboards in tools like Google Analytics are vital for this. This screenshot shows a typical dashboard view, presenting key metrics like user acquisition, engagement, and conversions all in one place.

This visual summary helps you quickly see which channels are bringing in the most valuable traffic and where engagement might be dropping off. For instance, if you notice a consistent decline in session duration from organic search over several weeks, it could mean your content no longer meets user intent. This gives you a chance to refresh your content before your rankings are negatively affected.
Ultimately, transforming data into campaign gold means treating your KPIs not as a final report card, but as a live, dynamic roadmap. It’s about asking "what’s next?" instead of just "what happened?". This forward-looking mindset is what separates good marketers from great ones, empowering them to refine strategies, allocate budgets more effectively, and consistently drive measurable business growth.
Avoiding The KPI Mistakes That Kill Campaigns
Choosing the right key performance indicators for digital marketing is a pivotal moment for any campaign. However, even seasoned marketers can stumble into common traps that waste resources and lead a promising strategy astray. These aren't just small slip-ups; they're fundamental errors in judgement about what your data is truly telling you. Sidestepping these mistakes is vital if you want your measurement strategy to be a real engine for growth, not just a source of confusing reports.
The most frequent error is getting dazzled by vanity metrics. These are the figures that look brilliant in a presentation but offer little substance about what’s actually contributing to your business goals. Think of numbers like social media followers or website page views. A huge follower count might feel like a win, but it reveals nothing about customer engagement, leads, or actual sales. A campaign could boast 1,000,000 impressions, but if it fails to convert a single customer, it hasn’t succeeded. The real risk with vanity metrics is that they create a false sense of achievement, hiding serious problems until it's too late.
Mistaking Correlation for Causation
Another major pitfall is confusing two trends that happen at the same time (correlation) with one causing the other (causation). This occurs when you see two metrics moving in tandem and automatically assume a cause-and-effect link. For instance, you might notice your website’s bounce rate dropped just as you launched a new blog series. It’s easy to conclude that your brilliant new content was the cause. In reality, the improvement might have come from an unrelated search engine algorithm update that started sending higher-quality traffic your way.
Basing your strategy on these false assumptions can lead you to pour time and money into the wrong places. To protect yourself from this trap:
- Isolate variables: Use A/B testing to change just one element at a time. This helps you pinpoint its direct impact.
- Dig deeper: Always look for other factors that could explain the change you're seeing in your KPIs.
- Question everything: Constantly challenge your assumptions. Could there be an alternative explanation for the trend?
The Trap of Over-Measurement
In the quest to be data-driven, it’s surprisingly easy to go too far and track absolutely everything. This quickly leads to analysis paralysis, a state where you are so swamped with data that making a clear, confident decision feels impossible. When you monitor dozens of KPIs, the important signals get lost in the noise. Your dashboard becomes a cluttered mess of conflicting numbers, obscuring what actually matters.
The answer is to be selective and strategic with your KPI selection. Concentrate on the handful of key performance indicators in digital marketing that are most directly connected to your main business objectives. A lean, focused set of metrics brings clarity and empowers you to act decisively. It ensures your team’s energy is channelled into optimising for results, not just generating endless reports.
Navigating these challenges is fundamental to building a strong and effective marketing strategy. At Blackbird Digital, we specialise in cutting through the noise to identify and track the metrics that deliver genuine, sustainable growth. If you’re ready to build a measurement framework that drives results, get in touch with our experts today.